4. Components
4.1. PostgreSQL
The Elephant Shed is based on postgresql-common, the default PostgreSQL
management system for Debian based installations. Tasks like creating, dropping
or renaming a PostgreSQL instance (“cluster” in PostgreSQL terms) should be
done through postgresql-common’s command line utilities pg_createcluster,
pg_dropcluster and pg_renamecluster.
4.1.1. Default Configuration
Beside the postgresql-common default configuration the
elephant-shed-postgresql package adds additional parameters for the cluster
creation process. Some of these parameters are required by the
Elephant Shed components. E.g. pgBadger requires some special
log_line_prefix. You can find this configuration under
/etc/postgresql-common/createcluster.d/elephant-shed.conf. Be
careful when changing any of these values.
4.1.2. Cluster Administration
To create a new cluster issue the command pg_createcluster <version> <name>.
Installed clusters and their status can be listed via
pg_lsclusters.
postgres@stretch:~$ pg_lsclusters
Ver Cluster  Port Status          Owner    Data directory  Log file
9.6 main     5432 online          postgres /9.6/main       /log/9.6-main.log
9.6 standby1 5433 online,recovery postgres /9.6/standby1   /log/9.6-standby1.log
9.6 standby2 5434 online,recovery postgres /9.6/standby2   /log/9.6-standby2.log
9.6 test     5435 online          postgres /9.6/test       /log/9.6-test.log
To delete a cluster use pg_dropcluster <version> <name> (be careful, this removes all data in the cluster as well!).
To start, stop, restart or reload use pg_ctlcluster <action> <version> <name> with the following commands as action:
startstoprestartreload
Alternatively, you can use systemctl (systemctl <action> postgresql@<version>-<name>) or the Cockpit web interface.
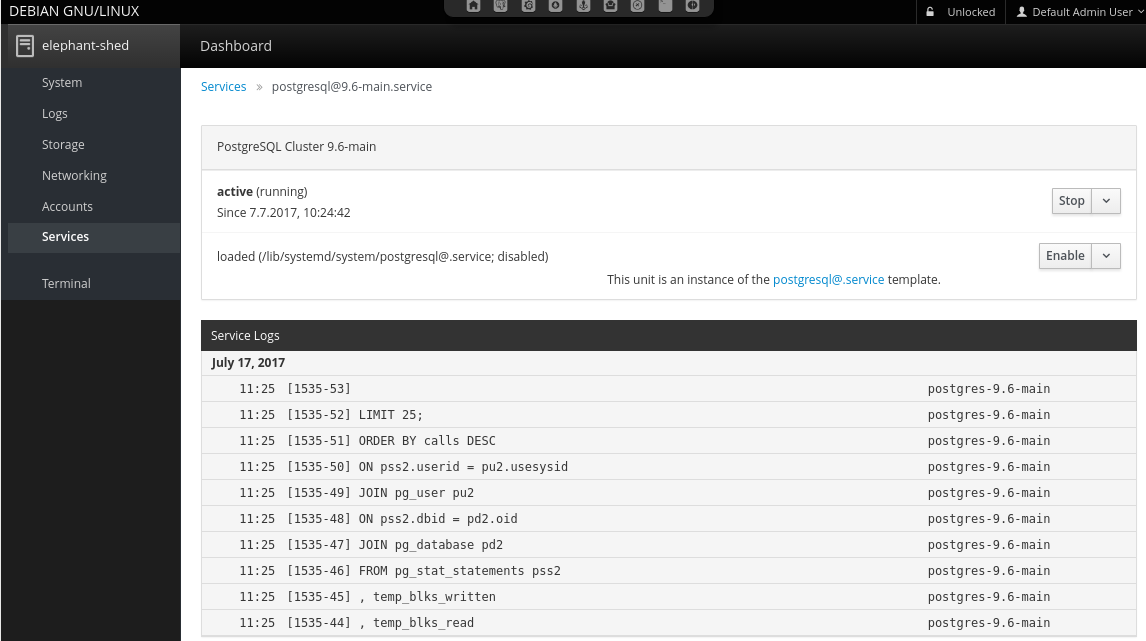
Note: Future versions of The Elephant Shed will include cluster management in the portal.
4.2. Portal
The portal serves as an entry point to all other web-based
interfaces. It uses HTTPS and basic authentication. Each user
within the Unix group elephant-shed has access to it (see Users).
The portal also shows the status of all PostgreSQL cluster including links to the Cockpit service (in order to start or stop the cluster), the log files, pgBadger reports and the backup software pgBackRest.
A navigation bar at the top allows switching between the different web services.
By default only a self signed certificate for HTTPS is deployed. A corresponding security warning is shown in most browsers. You can change the certificate with a signed one (e.g. from your company CA, or from Let’s Encrypt). The web services are served by Apache2. It also acts as a reverse proxy to serve all other web interfaces and to enforce authentication.
4.2.1. PostgreSQL Cluster
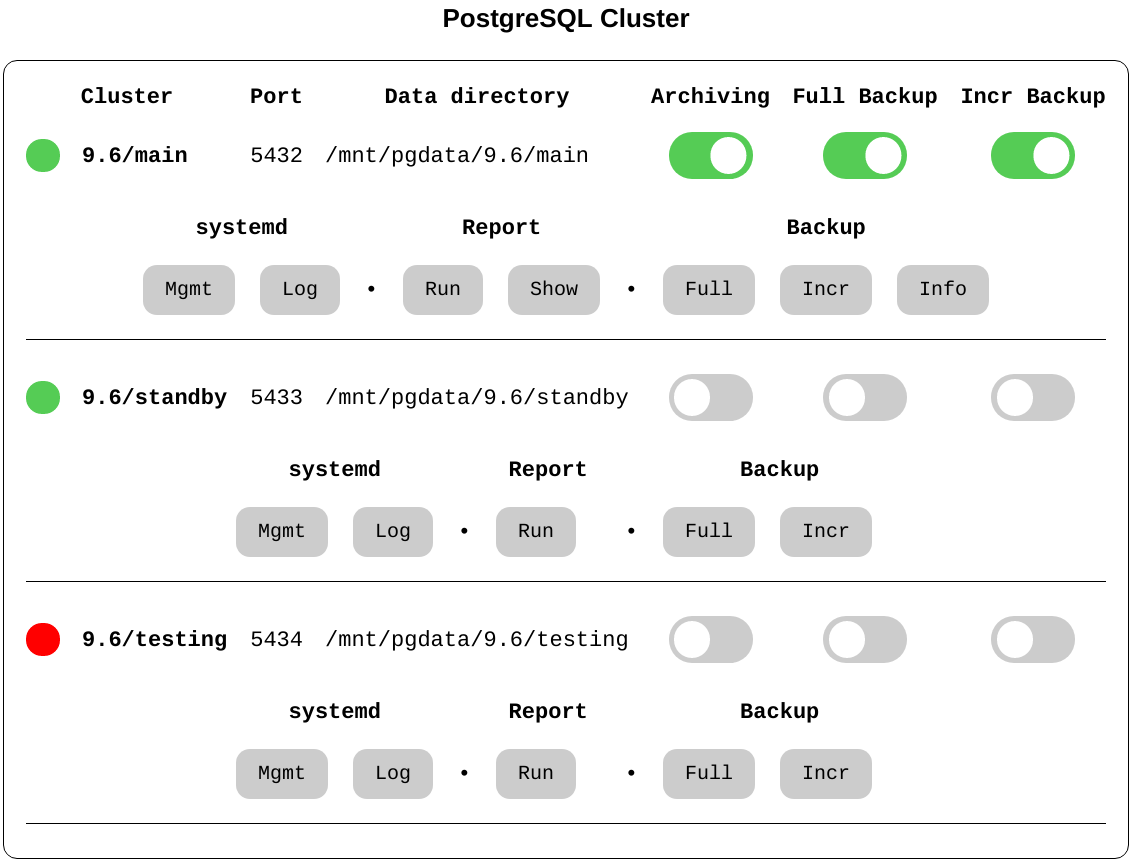
This section presents an overview of the existing PostgreSQL clusters and their status. For each cluster, a set of switches shows the current status. By clicking on a cluster an additional menu with buttons opens. Currently all buttons link to the corresponding components where a confirmation is required so no actions are triggered directly, but this may change in the future.
4.2.2. systemd - Service
This links to the configuration of this PostgreSQL cluster in Cockpit. Here it is possible to configure the corresponding service to be enabled or disabled on system start and also trigger actions like start, stop and reload.
4.2.3. systemd - Log
Links to the corresponding log entries in Cockpit if syslog is enabled for this cluster (which is the default for clusters created by Elephant Shed).
4.2.4. Report - Run
By default pgBadger reports for all clusters are generated once every night. With this service it is possible to generate a report for a specific cluster on demand.
4.2.5. Report - Show
Links to the corresponding pgBadger report overview. See pgBadger for more information.
4.8.5. Backup
This sections provides several functions for backups using pgBackRest. For more information about the backup tool pgBackRest visit pgBackRest.
4.2.6.1. Full
Link to Cockpit for starting an ad-hoc full backup.
4.2.6.2. Incremental
Link to Cockpit for staring an ad-hoc incremental backup.
4.2.6.3. Info
Shows the status of the backups. This button is only shown after the first backup run. Here the available backups and the content of the WAL archive is shown.
Additional information can be found here: http://www.pgbackrest.org/user-guide.html#quickstart/backup-info
4.2.7. Switches
4.2.7.1. Archiving
This switch shows if an archive command is set that uses pgBackRest. It is possible to set one or to deactivate the feature by using ‘/bin/true’. Archiving is needed for point in time recovery but more importantly for pgBackRest backups. Archiving will be activated automatic if a backup is triggered via the portal or timers.
To change it manually the service pgbackrest-toggle-archiving@<version>-<name>.service can be started.
This toggles the state.
4.8.1. Full Backup
Switch to enable or disable a periodical backup.
An enabled backup job (systemd timer) is shown by green color.
To start/stop the timer pgbackrest@<version>-<name>.timer needs to be started or stopped.
Enable/disable is used to enable/disable the timer after the next reboot.
4.2.7.3. Incr Backup
Switch to enable or disable a periodical backup.
An enabled backup job (systemd timer) is shown by green color.
To start/stop the timer pgbackrest-incr@<version>-<name>.timer needs to be started or stopped.
Enable/disable is used to enable/disable the timer after the next reboot.
4.3. Service Web Interface - Cockpit
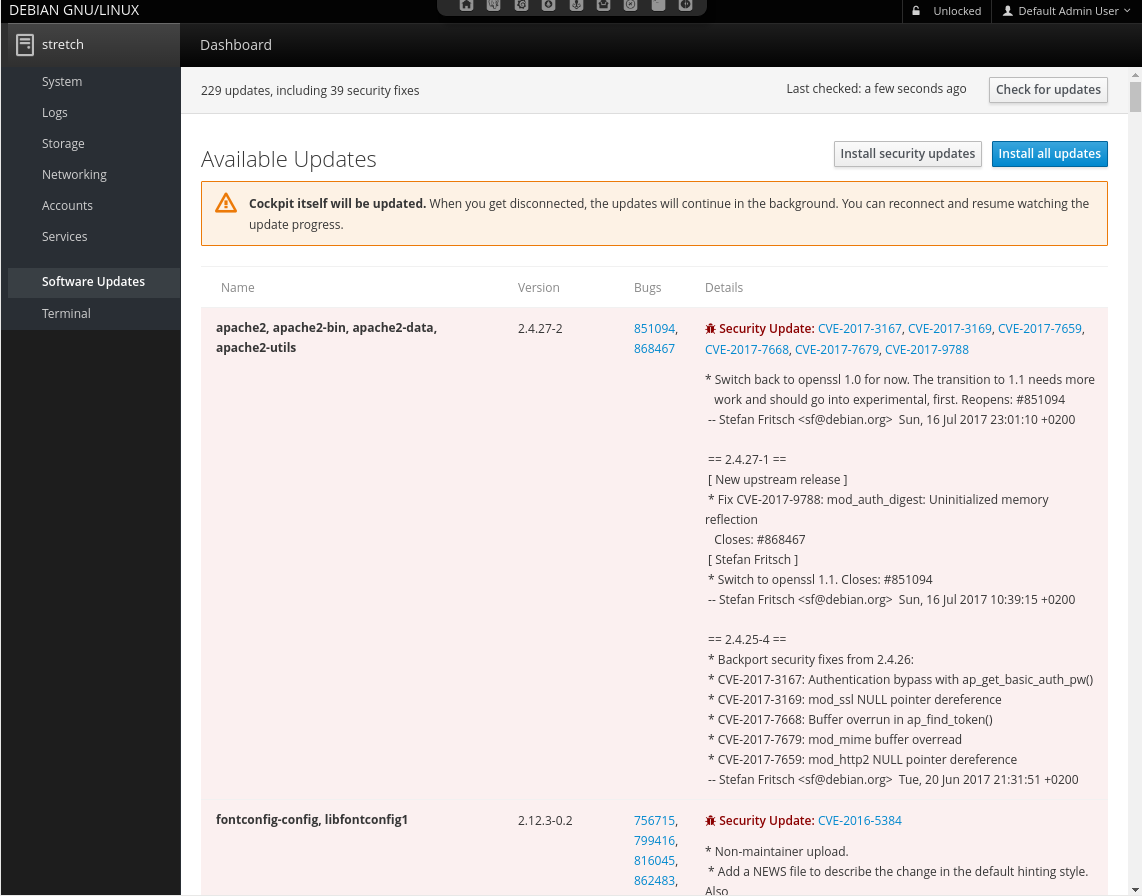
Cockpit allows remote management of all systemd related services via HTTPS. It makes starting, stopping or restarting of services as simple as clicking a button. It also shows system logs in real-time.
4.4. Monitoring - Prometheus
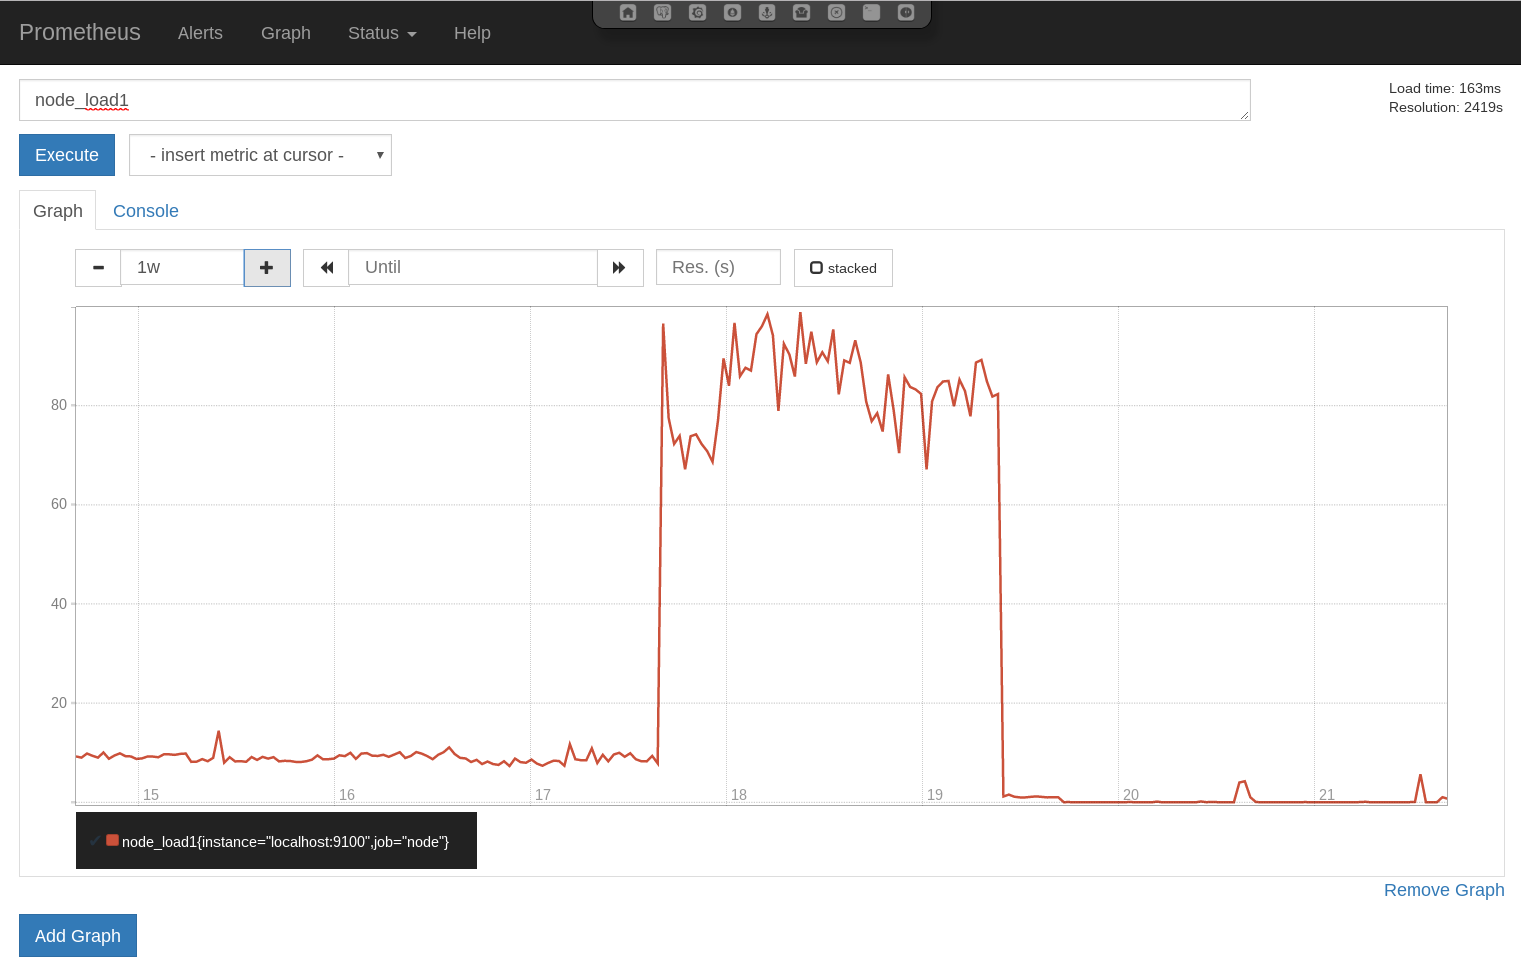
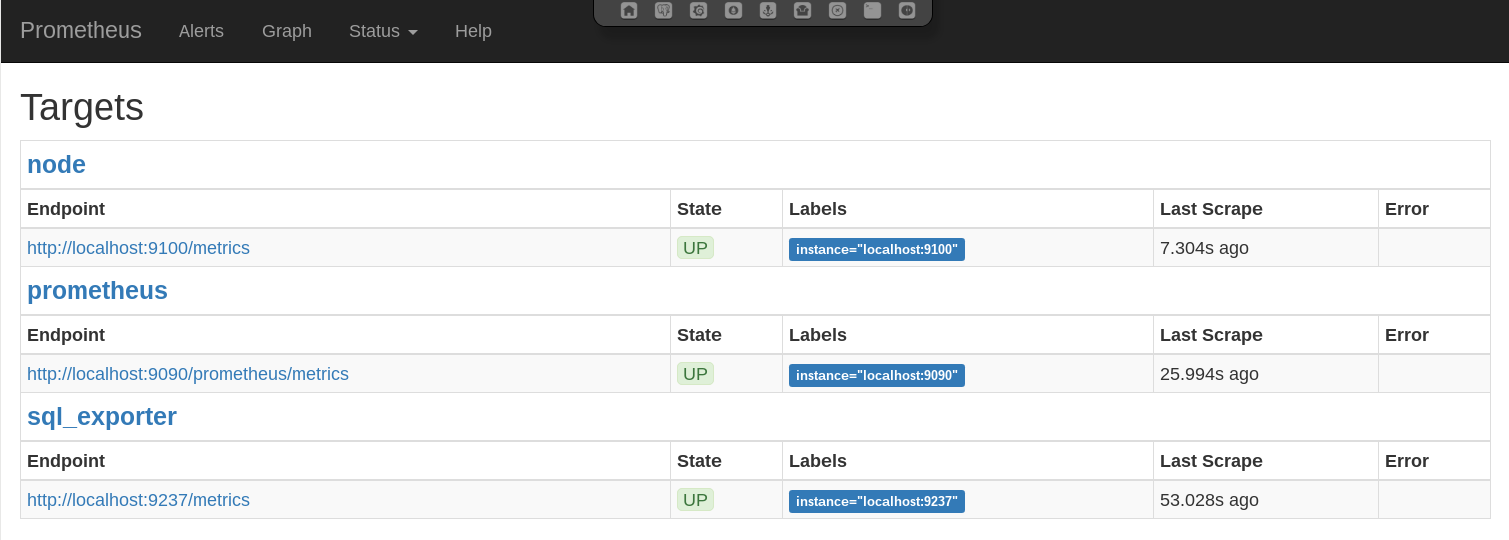
Prometheus is a metric based monitoring system for servers and services. It collects metrics from configured targets at given intervals, evaluates rule expressions, displays the results, and can trigger alerts if some condition is observed to be true.
4.4.1. Services
In this setup the Prometheus stack consists of different components controlled by systemd. The following units are deployed.
4.4.1.1. prometheus.service
Monitoring system and time series database - This is the monitoring service itself. It actively pulls the metrics from the different sources. It also provides internal metrics and a web interface which is accessible via the portal.
Configuration files:
/etc/prometheus/elephant-shed-prometheus.yml/etc/default/elephant-shed-prometheus
4.4.1.2. prometheus-node-exporter.service
Prometheus exporter for machine metrics - This service exports the system metrics and listens on port 9100. These metrics are collected every 30 seconds by default.
Configuration files:
/etc/default/elephant-shed-prometheus-node-exporter
4.4.1.3. prometheus-sql-exporter.service
Prometheus exporter for SQL metrics - This service collects the PostgreSQL specific metrics and listens on port 9237. The metrics are retrieved by querying the database. In order to not to generate additional load the metrics are collected only every 60 seconds.
WARNING: It is not advisable to set the monitoring interval for the prometheus-sql-exporter lower than 60 Seconds.
This could interference with normal applications and has a high impact on the PostgreSQL cluster.
The prometheus-sql-exporter.service starts one connection to each database on startup and keeps this connection open.
At the beginning of each connection the prometheus-sql-exporter.service checks if the extension pg_stat_statements is present.
If not, the service issues the statement CREATE EXTENSION pg_stat_statements.
Configuration files:
/etc/prometheus-sql-exporter.yml
4.4.1.4. update-prometheus-sql-exporter-config.timer
This timer triggers the update-prometheus-sql-exporter-config.service periodically which generates a new configuration for the prometheus-sql-exporter every 10 minutes.
This makes sure that every new database cluster and every new database is included in the monitoring automatically.
It’s possible to call the update-prometheus-sql-exporter-config.service manually to generate a new configuration directly.
Configuration template file:
prometheus-sql-exporter.yml.in
Configuration file (runtime):
prometheus-sql-exporter.yml
4.12.1. Additional Resources
4.5. Dashboard - Grafana
Grafana is a tool to create graphs and dashboards from a variety of different data sources. A PostgreSQL Server Overview dashboards is included in the default installation to get an overview over the most needed and many helpful metrics to manage and debug PostgreSQL servers.
These pre-deployed dashboards are shipped via the elephant-shed-graphana Debian package and can change in the future.
They are read only and need to be saved under a new name if you do any changes.
4.5.1. PostgreSQL Server Overview
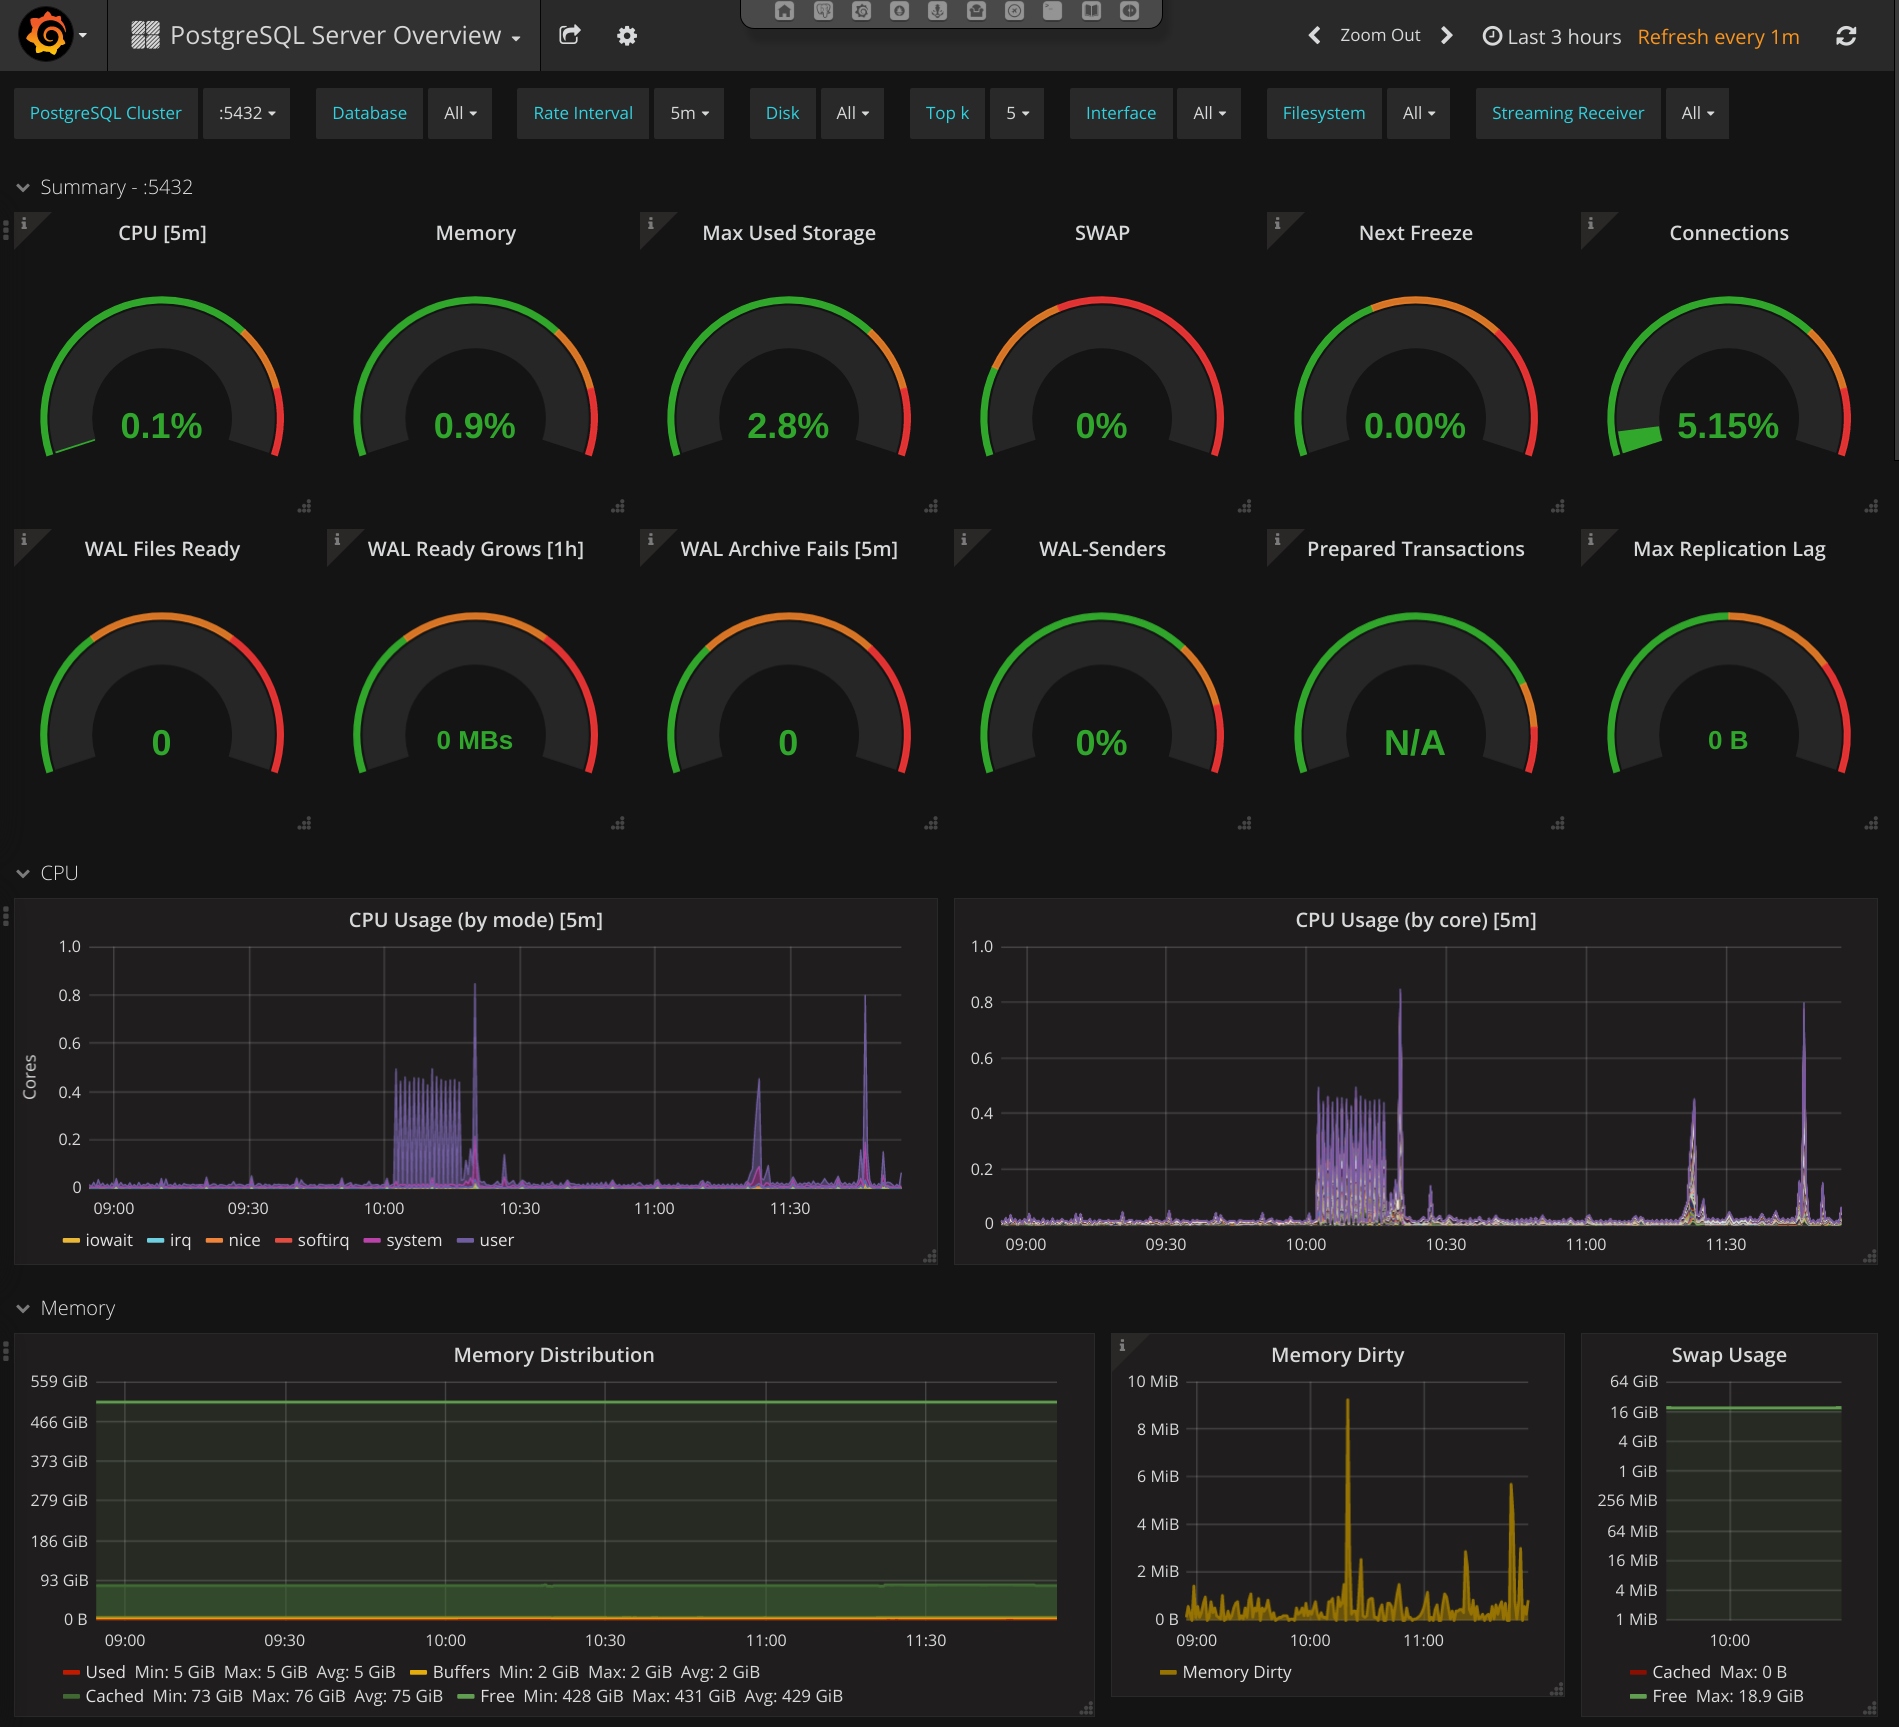
This dashboard starts with a summary section with simple gauges to provide a overview of the whole system. These gauges may indicate current problems or give a hint on problems that might occur in the future.
After the gauges in-depth metrics are shown as graphs.
4.5.2. Server metrics
Server metrics include e.g.: CPU usage (by type / by core), disk usage, disk utilization, network throughput, and much more. The following template filter are configured:
Disk: filter one or more disksInterface: filter on or more interfaceFilesystem: filter on or more filesystem / mountpoint
4.5.3. Cluster metrics
The next section contains PostgreSQL Cluster wide metrics like connections (by type / by database), number of transactions, database growth and more.
Only one cluster is shown by a time. To switch the current shown cluster use the template filter PostgreSQL Cluster.
4.5.4. Database metrics
Database level metrics are shown at the end of PostgreSQL Overview dashboard.
By default metrics for all databases of the current selected PostgreSQL cluster are shown.
To filter one or more databases the template filter Database could be used.
4.12.1. Additional Resources
4.6. DBA Tool - OmniDB
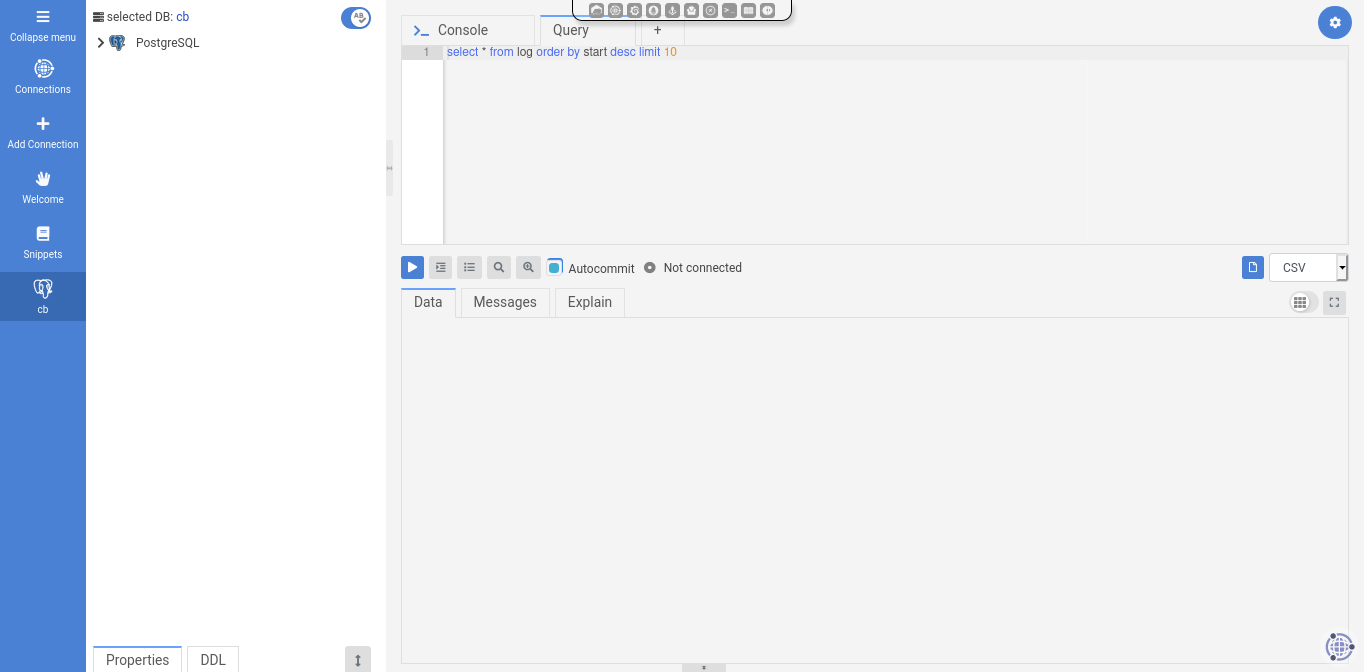
OmniDB is a management tool for PostgreSQL to help DBAs execute many different tasks. It provides user management, DDL functionality, an interactive SQL shell, and more.
4.12.1. Additional Resources
4.7. PoWA - PostgreSQL Workload Analyzer
The Elephant Shed includes integration with PoWA, a service that collects database metrics, most notably about running queries. There is some overlap with Prometheus and Grafana, but the PoWA statistics are much more detailed on the database level.
4.7.1. Setup
The PoWA web interface maintains a list of known clusters in the system in
/etc/powa-web.conf. To update that list, use:
update-powa-web-config
To enable PoWA monitoring for a cluster, run es_ctlcluster:
es_ctlcluster <postgresql_version> main enable-powa
In case of problems, the web interface will throw “Auth failed” errors for a
wide range of possible errors. Consulting the PostgreSQL server log in
/var/log/postgresql/postgresql-NN-main.log is often a good place to start
debugging.
4.8. Backup - pgBackRest
The Elephant Shed comes with a preinstalled backup solution, pgBackRest.
Each PostgreSQL instance can be backed up individually by issuing the command systemctl start pgbackrest@<version>-<name> or initiating a backup via Cockpit in the web interface.
A shortcut is listed for each instance.
Configuration entries for each cluster are created with the first
backup run. By default only db-path and db-port are set.
A list of all backups can be obtained by clicking on the pgBackRest icon on the portal site.
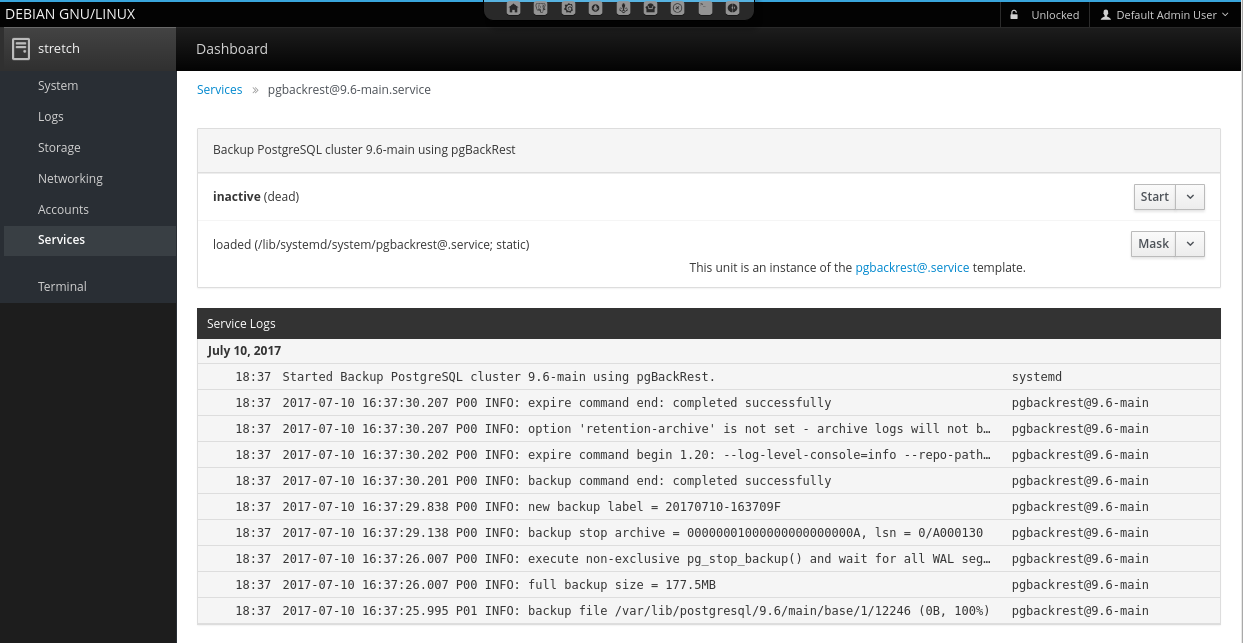
pgBackRest knows 3 types of backups full, incremental and differential. We are using full and differential by default. A service file for differential backups is not installed by default.
4.8.1. Full Backup
Full backups represent an complete backup of the database at a given point in time.
A backup consists of two parts, the backup itself, stored in backup and the WAL files which were written during the backup, stored in archive.
To ensure these WAL files are in the archive we automatically enable WAL archiving before the first backup is created.
Warning: If archiving is enabled all WAL files newer than the oldest stored backups are kept as well. This can consume a lot space in the backup location if backups are kept for a long time and archiving is not disabled. By deleting a backup the no longer needed WAL files are removed as well.
4.8.2. Incremental Backups
Incremental backups represent the changed data between a previous full backup and the current data at a given point. Incremental backups can be significant smaller than full backups but depend on a specific previous full backup. Without this full backup they can not be restored.
4.8.3. Retention
To clean up space old backups needs to be deleted. pgBackRest needs to know how many full backups to keep. If the number is reached all additional backups will be deleted starting with the oldest. If a full backup is deleted all incremental backups depending on it will be deleted as well. This is necessary because an incremental backup can not be restored without the matching full backup.
4.8.4. Configuration
The configuration file can be found in /etc/pgbackrest.conf.
[global]
repo-path=/var/lib/pgbackrest

[9.6-main]
db-path=/var/lib/postgresql/9.6/main
db-port=5432

[9.6-test]
db-port=5433
db-path=/var/lib/postgresql/9.6/test
The global part sets the default configuration for every existing and future database cluster. For each single cluster theses defaults can be changed. Some basic options will be explained here. Please see the documentation for a full overview.
If the server is setup using ansible, additionally the following [global] parameters are set:
[global]
retention-full=4
compress-level=6
spool-path=/mnt/backup/pgbackrest_spool
archive-async=y
archive-queue-max=1099511627776
repo-path=/mnt/backup/pgbackrest
...
4.8.4.1. retention-full
This option defines how many full backups should be kept.
Danger: If more full backups are stored than retention-full pgBackRest will delete the oldest backups to keep exactly retention-full full backups!
4.8.4.2. compress-level
The gzip compression level to use (6 is the default value).
4.8.4.3. archive-async
Enables asynchronous archiving of WAL files which allows a higher archiving throughput.
4.8.4.4. spool-path
Where to keep additional information for asynchronous archiving (status directory).
4.8.4.5. archive-queue-max
How many WAL segments to keep before throwing segments away. Note: We configure a value of 1TB to ensure pgbackrest never throws WAL segments away by default
4.8.4.6. repo-path
This sets the main directory where backups and WAL files are stored in. It can be set to any desired mount point so backups to remote servers are easily possible.
4.8.5. Backup
For each cluster there is a systemd service which does a full or incremental backup.
- pgbackrest@<version>-<name>
- pgbackrest-incr@<version>-<name>
To create an ad-hoc backup the corresponding service can be started.
systemctl start pgbackrest@9.6-main would create a full backup of the cluster 9.6-main.
If no previous full backup is available pgbackrest-incr@ will also create a full backup.
4.8.6. Automation
To automate the creation of backups and the retention policy enforcing there are two systemd timers per cluster.
- pgbackrest@
- .timer - pgbackrest-incr@
- .timer - pgbackrest-incr@
pgbackrest@<version>-<name>.timer triggers full backups and pgbackrest-incr@<version>-<name>.timer triggers incremental backups.
These timers are created for every cluster and are initialized with a default timing.
The timers can be enabled independently for every database cluster either via systemd or the web portal.
To fully enable a timed backup the timer must be started and enabled.
If the timer is started but not enabled systemd will not start it after the next reboot.
Keep in mind that enabling only the incremental backup is only reasonable for shorter periods of time, special scenarios like not changing databases, or if the full backups are triggered in another way. To keep storage and restore time at an reasonable level periodic full backups are needed.
4.8.6.1. pgbackrest@.timer
# /lib/systemd/system/pgbackrest@.timer
[Unit]
Description=Automated pgBackRest full backup of PostgreSQL cluster %i

[Timer]
OnCalendar=Sun *-*-* 01:00:00
RandomizedDelaySec=2h

[Install]
WantedBy=multi-user.target
This timer triggers a full backup every Sunday in the early morning 01:00 or randomly up to 2 hours later.
The random delay set by RandomizedDelaySec=2h is set so systemd can schedule many timers over a given time range.
Here it is done so that not all backups for all clusters start at the same time blocking the I/O.
4.8.6.2. pgbackrest-incr@.timer
# /lib/systemd/system/pgbackrest-incr@.timer
[Unit]
Description=Automated pgBackRest incremental backup of PostgreSQL cluster %i

[Timer]
OnCalendar=Tue,Thu *-*-* 01:00:00
RandomizedDelaySec=2h

[Install]
WantedBy=multi-user.target
This timer triggers an incremental backup every Tuesday and Thursday in the early morning 01:00 or randomly up to 2 hours later.
4.8.6.3. WAL Archiving
WAL archiving is disabled by default for new PostgreSQL clusters.
It can be activated using the portal (see portal) or by starting pgbackrest-toggle-archving.service.
The service toggles archiving mode to on or off, depending on the former state.
Note: If archiving is disabled and a full or incremental backup is started (manual or via timer), archiving is automatically enabled. This step is required to ensure all WAL files need for a restore are archived beside the basebackup. Archiving is not disabled after the backup run.
4.8.7. Restore
Restore is an invasive action that can destroy data if not executed properly!
To restore a backup there are two main methods full and delta.
4.8.7.1. Full Restore
A full restore restores a given backup (by default the latest) to the given (default) destination. The restore command expects the target directory to be empty. This can be used to setup a cluster on a new machine, small clusters or if most of the remaining data is incorrect.
Steps to full restore.
- Stop the cluster (if still running)
- Delete or move all remaining data
- Restore full content from backup
All steps should be run as user postgres.
# 1. Stop the cluster
pg_ctlcluster <major version> <name> stop

# 2. Delete or move all remaining data
mv /var/lib/postgresql/<major version>/<name> /var/somewhere-save
mkdir /var/lib/postgresql/<major version>/<name>

# 3. Restore full content from backup
pgbackrest --stanza=<major version>-<name> restore
After this the cluster can be started again. If there is enough storage available it should be preferred to move the data to a save place instead of deletion.
4.8.7.2. Delta Restore
A delta restore does not need a clean target and it only copies files that differ from backup. This approach can be much faster especially if most of the underling files did not change since the last backup.
This has the potential to destroy data! Because this works on the cluster data it is possible to cause damage. Data that is not in the backup / WAL archive but in the current cluster will be lost!
Steps to perform a delta restore.
- Stop the cluster (if still running)
- Restore delta content from backup
# 1. Stop the cluster
pg_ctlcluster <major version> <name> stop

# 2. Restore full content from backup
pgbackrest --stanza=<major version>-<name> --delta restore
After this the cluster can be started again.
4.8.7.3. Point in Time Recovery
The shown backups methods do a full restore. This means a all basebackup files and copied back from the archive and all WAL files are applied.
If another recovery target should be restored --type and --target must be specified.
Most of the time one would like to restore a database to a given point in time (e.g. ‘2017-08-24 12:00:00’).
This would require the switch --type=time and --target='2017-08-24 12:00:00'.
pgbackrest --stanza=<major version>-<name> --type=time --target="<ISO timestamp>" restore
4.9. Reporting - pgBadger
A pgBadger service is created for each PostgreSQL instance. Those services are autogenerated and updated each time a new cluster is created or dropped (systemd-generators).
A pgBadger systemd timer ensures reports are updated on a regular basis. By default this is every day at 23:00.
Each pgBadger service parses the PostgreSQL log file of the
corresponding PostgreSQL instance. Generated reports are saved within
/var/lib/pgbadger/<version>-<name> (e.g. /var/lib/pgbadger/9.6-main/).
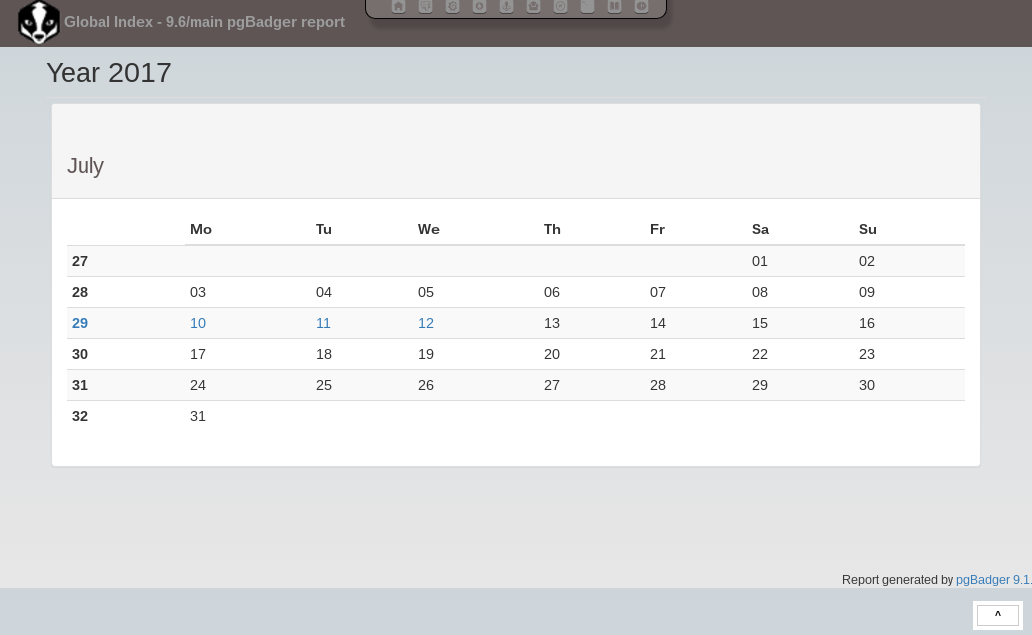
All reports are accessible in the web interface. An calendar provides access to daily and weekly reports.
A manual update of those reports can be triggered either using the corresponding service (e.g. pgbadger@9.6-main.service) or using the portal.
A update of all reports could be triggered using the parent service pgbadger.service.
Note: Changing postgresql.conf settings like log_line_prefix or
lc_messages can lead to pgBadger reports not getting updated anymore.
4.10. Web Terminal - Shell In A Box
Shell In A Box is a convenient web based terminal. It can be used like a normal console connection. Explicit login and authentication is required. To change settings (e.g. the color theme) just right click anywhere on the terminal window.
4.12.1. Additional Resources
4.11. Remote Control - tmate
tmate is a fork of the popular terminal multiplexer tmux. It is used to provide remote support if needed.
It is preconfigured to connect to a relay server (tmate.credativ.com) and enables the user to share the current terminal with a third party by sending an SSH command including a secret token.
There are two modes of operation, read-write and read-only. This enables the user to give a third party temporary access to the current terminal. The user can always watch the terminal and audit the actions taken by the third party.
- tmate is not running by default, it needs to be started explicitly
- When the initiating shell is closed, the connection is closed as well
- The backend to use is fully configurable (in
/etc/tmate.conf) and preset totmate.credativ.com - tmate is included as a technical preview to evaluate the potential
4.11.1. Usage
Start tmate (opens a new terminal)
tmate
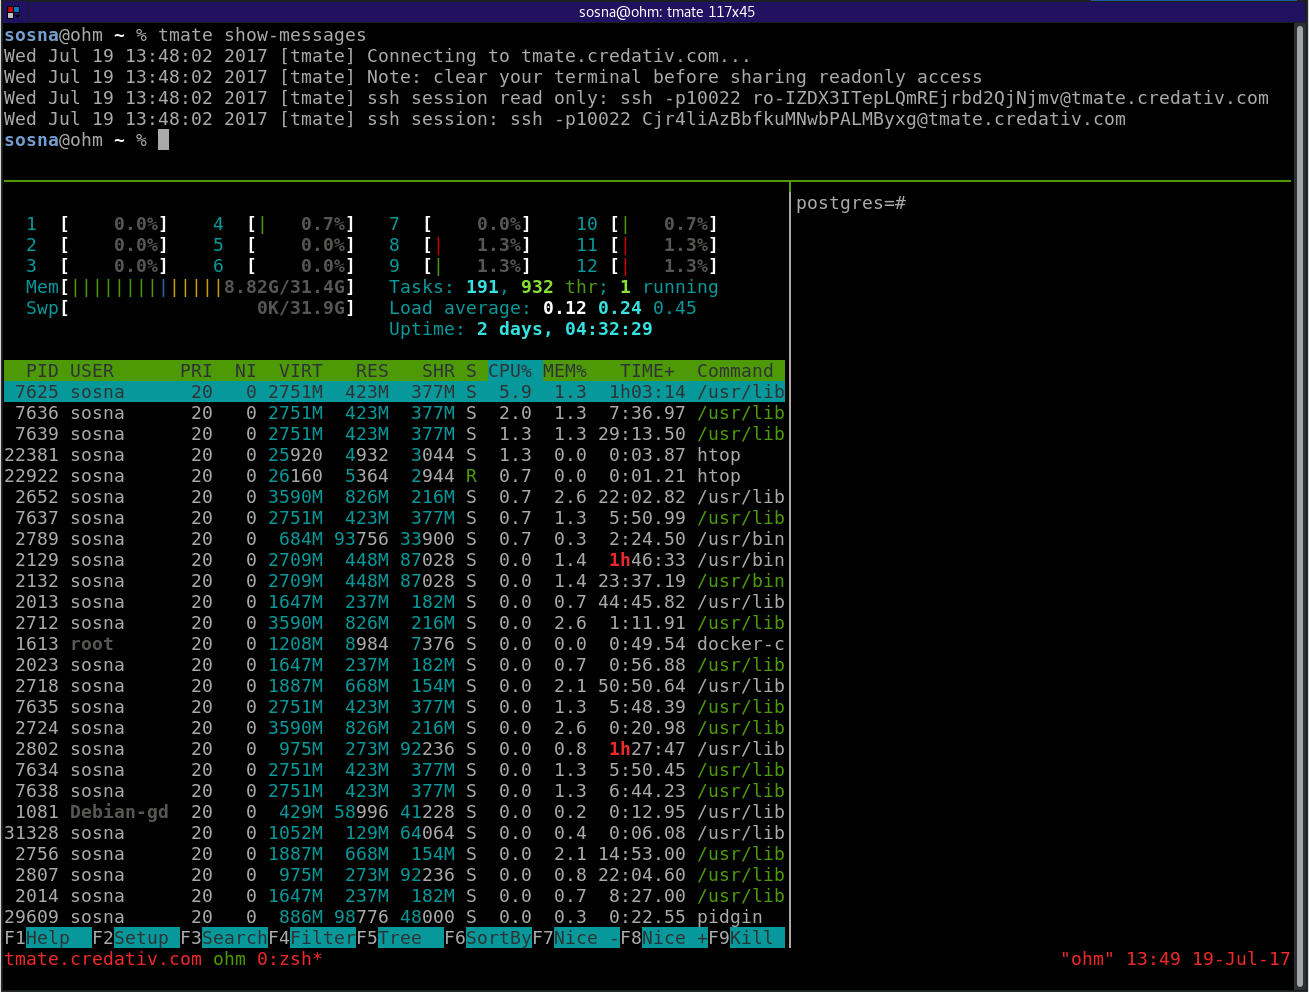
Show the credentials which need to be given to a third party (securely)
tmate show-messages
For further usage see the following additional resources regarding tmux.
4.12.1. Additional Resources
4.12. Configuration Revision - etckeeper
etckeeper is a set of tools and hooks to keep all configuration in /etc in a git repository.
Commits can be done manually or will happen automatically via time or by package manager hooks.
Configuration changes can be seen and compared to previous versions. If necessary previous settings can be restored.